Structure Analysis
Table of Contents
Distance Between Alpha Carbons
Calculating Distance Between Alpha Carbons in a PDB File
Acquisition of the spatial data in PDB files
In proteins, structure and function are tightly linked, such that biochemical understanding of the protein is often contingent on understanding the relationship between atoms in space. The spatial and atomic information stored in a PDB file is derived from crystallization and diffraction of the purified protein, followed by phase reconstruction and model refinement. Although there are other methods for obtaining spatial information about proteins, including NMR, SAXS and, more recently, electron cryo-microscopy, protein crystal diffraction remains the gold standard for atomic resolution of structure. Thus, the majority of PDB files deposited in various databases were obtained by this method. These databases include RCSB [1], the central wwPDB archive [2], and national PDB archives (PDBe and PDBj) [3,4], which allow users to search for and visualize structures.
The first few lines of the PDB file define the HEADER, TITLE, and AUTHOR in order to provide information about the protein, the method used to obtain the structure, and the structure depositors. Further annotations about the protein are found in the REMARK section. SEQRES defines the sequences of the individual protein chains within the larger structure, using the three-letter amino acid abbreviation code. Lines labeled ATOM provide information about the individual atoms within the protein. Columns 2 through 11 within the ATOM records describe, respectively: atom index number, atom type (i.e. N, C, CA, etc.), amino acid identity using the three-letter code, chain identity, the x, y, and z coordinates in angstroms, occupancy, temperature factor, and element identity. In the tool below, we use the coordinates in the ATOM records to calculate the distances between atoms. If there are atoms which are not part of the protein molecule in the structure, those heteroatoms are recorded on HETATM lines.
Calculating the distance between alpha carbons
Here, we generate a tool which can identify the distance between any two alpha carbons in a protein. We ask the user to input the PDB file of interest and the indices of the alpha carbons. These indices correspond to the residue number of the alpha carbon’s associated amino acid in the primary sequence of the protein. After extracting the x,y,z coordinates for two given alpha carbons from the PDB file, we use the following formula to calculate the distance between them:

This output, given in angstroms, is useful in several ways. First, it provides general information about where two carbons are, relative to each other in space. More importantly, this distance can be used to determine whether certain forces and interactions between the atoms are relevant. For example, we can use the calculated distance in coarse-grained models where we only consider interactions between amino acid residues within a certain radius of each other. These models, termed elastic network models, treat proteins like a network of alpha carbons in which each alpha carbon is connected by virtual springs to every other alpha carbon within a distance cutoff [5]. Because of their simplicity, elastic network models and other distance-cutoff models can be used to model protein flexibility in molecular dynamics simulation without requiring excessive computational power.
Python Code
R Code
References
[1] http://www.rcsb.org/pdb/home/home.do [2] http://www.wwpdb.org/ [3] http://www.ebi.ac.uk/pdbe/ [4] http://pdbj.org/ [5] Yang, L-W. & Chng, C-P. Coarse-Grained Models Reveal Functional Dynamics - I. Elastic Network Models – Theories, Comparisons and Perspectives. Bioinform Biol Insights, 2, 25-45 (2008).
Calculating the Lennard-Jones Potential from a Query Point and a PDB File
What is the Lennard-Jones potential and why is it useful in science?
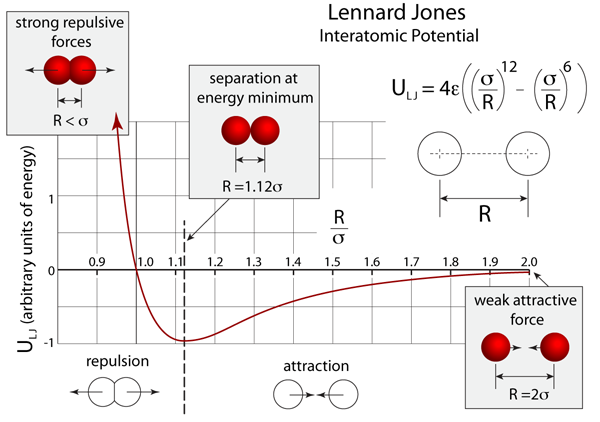
The Lennard-Jones potential is a force that describes the interaction between a pair of atoms [1]. The equation is:

V is the intermolecular potential. σ is the distance where V is 0. r is the distance between atoms. ε is the interaction strength/depth of potential well (eq from https://github.com/CBB752Spring2016/pattern_classification/blob/master/resources/latex_equations.md#lennard-jones-potential).
This equation is useful in describing the stable conformations of molecules and polypeptides. This force is weakly attractive to uncharged particles, but if they get too close there will be a repulsive effect. The attractive force is a combination of Van der Waalsand ion-induced dipole dipole force, while the repulsive force is because atoms can’t squish each other. Below is a graph of two atoms’ Lennard-Jones potential as they experience repulsion from being very close to a mild attraction at a larger distance. (ref: http://atomsinmotion.com/book/chapter5/LennardJones.png)
Lennard-Jones potential is used to study fundamental repulsion and attraction phenomenon at long distances in gases and liquids. When gases are compressed, the particles are more attracted to each other and will form liquids and solids when sufficiently condensed [2]. In biology, Lennard-Jones potential can also be used to find the forces acting on specific atoms of the amino acid residues that make up a protein. Calculating these values for specific amino acid residues will help determine their most favorable conformations in a protein core which will contribute to the knowledge of protein structure and folding.
What is a PDB file?
Program database (PDB) file format is used in biology to organize protein structures data solved by X-ray diffraction and NMR experiments. Information included in such a file include the protein’s name, the group the solved the structure, what resolution it was solved, and other general information. The PDB file is immensely important for our tool, as positions and relationships of specific atoms within amino acid residues of protein structures are determined accurately. PDB files are organized on the RCSB protein data bank as well as the Worldwide Protein Data Bank.
How will our tool calculate the Lennard-Jones potential?
Our tool will calculate the Lennard-Jones potential by taking in a PDB file as input, where the coordinates x, y, and z of the atoms in the protein structure will be parsed into the tool in units of Angstroms. The default values for epsilon ε will be 1 kcal/mol, and the sigma σ will be 5 Angstroms. These values are chosen from Veitshans, et al. 1997 [3]. The tool extracts all the alpha carbons from the protein structure and categorize them into group of hydrophilic (ie: Arginine), hydrophobic (ie: Alanine), and neutral (ie: Glycine) proteins in accordance with the BLN model. This distinction is important as these three groups of residues have different interaction potentials. The distance from the query point to the alpha carbon will be calculated, then the Lennard-Jones potential can be calculated for all amino acid residues and summed up with respect to the query point.
Python Code
R Code
References:
[1] Lennard-Jones, J. 1924. On the Determination of Molecular Fields. Proc. R. Soc. Lond. A. 106 (738): 463–477.
[2] Zeng, X. and Oxtoby, D. 1990. Gas-liquid nucleation in Lennard-Jones fluids. The Journal of Chemical Physics 94(6):4472-4478.
[3] Veitshans, T. et al., 1997. Protein folding kinetics: timescales, pathways and energy landscapes in terms of sequence-dependent properties. Fold Des. 2(1):1-22.
Calculating Dihedral Angles from PDB file
Protein Backbone Dihedral Angles
The phi and psi protein backbone dihedral angles define the two degrees of freedom of the backbone and sterically determine much of the protein’s local folding structure. Because dihedral angles characterize the angle of rotation between two planes, they are defined by four spatial points. The phi angle measures the angle around the N-Cα bond in the consecutive sequence C’-N-Cα-C. The first C’ in this definition comes from the prior amino acid residue. The psi angle measures the angle around the Cα-C bond in the sequence N-Cα-C-N’, where the last N’ comes from the next amino acid residue. The final possible dihedral angle is omega (Cα’-C’-N-Cα), the peptide bond, which is fixed at (0, 180°) because the partial double bond character of the peptide bond does not allow rotation around the C’-N bond.

Phi and psi dihedral angles are restricted to certain values, because many angles will produce steric clashes between the backbone and the side chains in the polypeptide sequence. Sterically allowable phi/psi combinations were calculated in the 1963 by G.N. Ramachandran and colleagues using first a hard sphere model and then a reduced radius model. Their findings are presented below in the Ramachandran plot, a phi/psi map which plots regions of allowed dihedral angles. Larger atom sizes produce narrower Ramachandran limits (dark blue regions), while smaller atoms have some more flexibility (light blue regions). In addition, we also note that certain secondary structures have characteristic phi/psi angles. For example, right-handed alpha helices are found in the region around Φ=+45°, Ψ=-45°, while beta sheets are found in the top left-hand corner of the plot. Recent advances in data mining and protein simulation have verified the allowable phi/psi angles predicted by the Ramachandran plot. Studies by Zhou et al. have found that sterics alone can account for the range of phi/psi angles observed in Protein Data Bank structures [1]. Likewise, simulations of coarse-grained hard-sphere models which incorporate only steric interactions have been sufficient recapitulate the biologically observed range of dihedral angles in both backbones and side chains [2]. Thus, when modeling protein folding, backbone dihedral angles are incredibly important constraints on the structure and behavior of the protein. In addition, we can assess the quality of a proposed protein structure by ensuring that its backbone dihedral angles all fall within allowable phi/psi ranges.

Calculating Dihedral Angles
Given the spatial coordinates (x,y,z) of the four points which define two planes, we can calculate the angle between them (theta) in two ways. First, we can find the normal vectors for each plane, n1 and n2, such that each vector is perpendicular to the plane. For two planes with the following Cartesian definition, the normal vectors are n1 = (a1, b1, c1) and n2 = (a2, b2, c2):

In vector notation, we can find the normal vectors by taking the cross-product of two non-collinear vectors on that plane. The cosine of the dihedral angle theta is defined as the dot product of the normal vectors n1 and n2. For a Cartesian definition, this is extremely simple to calculate:

Likewise, in vector notation, the dihedral angle (indicated as phi) defined by points i,j,k,l, the dot product of the normalized vectors can be used to calculate cosine and sine using the same vector definition as shown above:

In vector notation, because the arccosine and arccsine functions are limited in range from 0 to π and -π/2 to π/2 radians respectively, implementing this definition to calculate the dihedral angle produces problems of signage. The atan2 function maintains signage information from the cosine and sine angles and and outputs a dihedral angle value in the range (-180°, 180°]. To calculate the dihedral angle phi with this function, we input the x coordinate as cos(phi) and the y coordinate as sin(phi).

Python Code
R Code
References
[1] Zhou, AQ, O’Hern, CS, Regan, L (2011). Revisiting the Ramachandran plot from a new angle. Protein Sci., 20, 7:1166-71 [2] Zhou, AQ, O’Hern CS, and Regan, L (2014). Predicting the side-chain dihedral angle distributions of non-polar, aromatic, and polar amino acids using hard-sphere models. Proteins: Structure, Function, and Bioinformatics, 82, 2574.